import pandas as pd
import matplotlib.pyplot as plt10 Desempaca listas
def suma_tres(a,b,c):
return a + b + csuma_tres(1,1,1)3numeros = [1, 1, 1]suma_tres(numeros)--------------------------------------------------------------------------- TypeError Traceback (most recent call last) Cell In[5], line 1 ----> 1 suma_tres(numeros) TypeError: suma_tres() missing 2 required positional arguments: 'b' and 'c'
suma_tres(*numeros)3print(numeros)[1, 1, 1]print(*numeros)1 1 1

f = "../../data/personas_cargas.csv"
horario = pd.read_csv(f,index_col=0,parse_dates=True)
horario| BATH_2_LIGHT:Lights Electricity Rate (W) | BATH_LIGHT:Lights Electricity Rate (W) | COCINA_ESTUFA_EQUIPMENT:Electric Equipment Electricity Rate (W) | COCINA_REFR_EQUIPMENT:Electric Equipment Electricity Rate (W) | ESTANCIA_COCINA_LIGHT:Lights Electricity Rate (W) | ESTANCIA_TV_EQUIPMENT:Electric Equipment Electricity Rate (W) | R_1_LIGHT:Lights Electricity Rate (W) | R_2_LIGHT:Lights Electricity Rate (W) | R_3_LIGHT:Lights Electricity Rate (W) | STAND_BY_EQUIPMENT:Electric Equipment Electricity Rate (W) | B1:Space People Occupant Count () | B2:Space People Occupant Count () | COCINA:Space People Occupant Count () | R1:Space People Occupant Count () | R2:Space People Occupant Count () | R3:Space People Occupant Count () | |
|---|---|---|---|---|---|---|---|---|---|---|---|---|---|---|---|---|
| date | ||||||||||||||||
| 2006-01-01 00:01:00 | 0.0 | 0.0 | 0.0 | 40.0 | 0.0 | 0.0 | 0.0 | 0.0 | 0.0 | 50.0 | 0.0 | 0.0 | 0.0 | 1.0 | 2.0 | 1.0 |
| 2006-01-01 00:02:00 | 0.0 | 0.0 | 0.0 | 40.0 | 0.0 | 0.0 | 0.0 | 0.0 | 0.0 | 50.0 | 0.0 | 0.0 | 0.0 | 1.0 | 2.0 | 1.0 |
| 2006-01-01 00:03:00 | 0.0 | 0.0 | 0.0 | 40.0 | 0.0 | 0.0 | 0.0 | 0.0 | 0.0 | 50.0 | 0.0 | 0.0 | 0.0 | 1.0 | 2.0 | 1.0 |
| 2006-01-01 00:04:00 | 0.0 | 0.0 | 0.0 | 40.0 | 0.0 | 0.0 | 0.0 | 0.0 | 0.0 | 50.0 | 0.0 | 0.0 | 0.0 | 1.0 | 2.0 | 1.0 |
| 2006-01-01 00:05:00 | 0.0 | 0.0 | 0.0 | 40.0 | 0.0 | 0.0 | 0.0 | 0.0 | 0.0 | 50.0 | 0.0 | 0.0 | 0.0 | 1.0 | 2.0 | 1.0 |
| ... | ... | ... | ... | ... | ... | ... | ... | ... | ... | ... | ... | ... | ... | ... | ... | ... |
| 2006-01-01 23:55:00 | 0.0 | 0.0 | 0.0 | 40.0 | 0.0 | 0.0 | 0.0 | 0.0 | 0.0 | 50.0 | 0.0 | 0.0 | 0.0 | 1.0 | 2.0 | 1.0 |
| 2006-01-01 23:56:00 | 0.0 | 0.0 | 0.0 | 40.0 | 0.0 | 0.0 | 0.0 | 0.0 | 0.0 | 50.0 | 0.0 | 0.0 | 0.0 | 1.0 | 2.0 | 1.0 |
| 2006-01-01 23:57:00 | 0.0 | 0.0 | 0.0 | 40.0 | 0.0 | 0.0 | 0.0 | 0.0 | 0.0 | 50.0 | 0.0 | 0.0 | 0.0 | 1.0 | 2.0 | 1.0 |
| 2006-01-01 23:58:00 | 0.0 | 0.0 | 0.0 | 40.0 | 0.0 | 0.0 | 0.0 | 0.0 | 0.0 | 50.0 | 0.0 | 0.0 | 0.0 | 1.0 | 2.0 | 1.0 |
| 2006-01-01 23:59:00 | 0.0 | 0.0 | 0.0 | 40.0 | 0.0 | 0.0 | 0.0 | 0.0 | 0.0 | 50.0 | 0.0 | 0.0 | 0.0 | 1.0 | 2.0 | 1.0 |
1439 rows × 16 columns
people = [columna for columna in horario.columns if "People" in columna]
electricos = [columna for columna in horario.columns if "(W)" in columna]

people,electricos
(['B1:Space People Occupant Count ()',
'B2:Space People Occupant Count ()',
'COCINA:Space People Occupant Count ()',
'R1:Space People Occupant Count ()',
'R2:Space People Occupant Count ()',
'R3:Space People Occupant Count ()'],
['BATH_2_LIGHT:Lights Electricity Rate (W)',
'BATH_LIGHT:Lights Electricity Rate (W)',
'COCINA_ESTUFA_EQUIPMENT:Electric Equipment Electricity Rate (W)',
'COCINA_REFR_EQUIPMENT:Electric Equipment Electricity Rate (W)',
'ESTANCIA_COCINA_LIGHT:Lights Electricity Rate (W)',
'ESTANCIA_TV_EQUIPMENT:Electric Equipment Electricity Rate (W)',
'R_1_LIGHT:Lights Electricity Rate (W)',
'R_2_LIGHT:Lights Electricity Rate (W)',
'R_3_LIGHT:Lights Electricity Rate (W)',
'STAND_BY_EQUIPMENT:Electric Equipment Electricity Rate (W)'])horario[electricos].dtypesBATH_2_LIGHT:Lights Electricity Rate (W) float64
BATH_LIGHT:Lights Electricity Rate (W) float64
COCINA_ESTUFA_EQUIPMENT:Electric Equipment Electricity Rate (W) float64
COCINA_REFR_EQUIPMENT:Electric Equipment Electricity Rate (W) float64
ESTANCIA_COCINA_LIGHT:Lights Electricity Rate (W) float64
ESTANCIA_TV_EQUIPMENT:Electric Equipment Electricity Rate (W) float64
R_1_LIGHT:Lights Electricity Rate (W) float64
R_2_LIGHT:Lights Electricity Rate (W) float64
R_3_LIGHT:Lights Electricity Rate (W) float64
STAND_BY_EQUIPMENT:Electric Equipment Electricity Rate (W) float64
dtype: objectfig, ax = plt.subplots(figsize=(12,6))
ax.stackplot(horario.index,
horario[electricos[0]],
horario[electricos[1]],
horario[electricos[2]],
horario[electricos[3]],
horario[electricos[4]],
horario[electricos[5]],
horario[electricos[6]],
horario[electricos[7]],
horario[electricos[8]],
horario[electricos[9]],
# data[electricos[8]],
labels=electricos
)
ax.legend(loc="upper left",
# ncols=6,
fontsize=6)
ax.grid()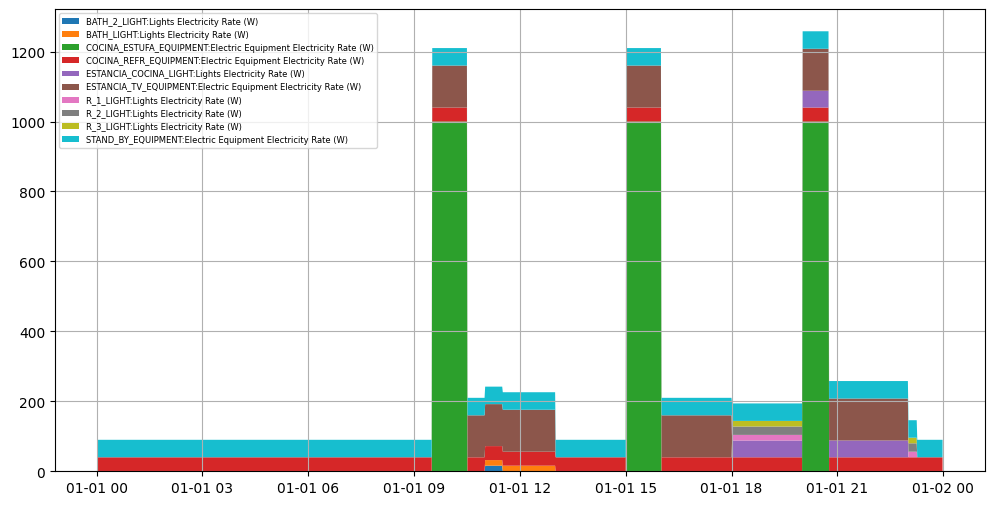
fig, ax = plt.subplots(figsize=(12,6))

ax.stackplot(horario.index,horario[electricos],labels=electricos)

ax.legend()
--------------------------------------------------------------------------- ValueError Traceback (most recent call last) Cell In[7], line 3 1 fig, ax = plt.subplots(figsize=(12,6)) ----> 3 ax.stackplot(horario.index,horario[electricos],labels=electricos) 5 ax.legend() File ~\venv\alldays\Lib\site-packages\matplotlib\__init__.py:1486, in _preprocess_data.<locals>.inner(ax, data, *args, **kwargs) 1483 @functools.wraps(func) 1484 def inner(ax, *args, data=None, **kwargs): 1485 if data is None: -> 1486 return func( 1487 ax, 1488 *map(sanitize_sequence, args), 1489 **{k: sanitize_sequence(v) for k, v in kwargs.items()}) 1491 bound = new_sig.bind(ax, *args, **kwargs) 1492 auto_label = (bound.arguments.get(label_namer) 1493 or bound.kwargs.get(label_namer)) File ~\venv\alldays\Lib\site-packages\matplotlib\stackplot.py:129, in stackplot(axes, x, labels, colors, hatch, baseline, *args, **kwargs) 126 stack += first_line 128 # Color between x = 0 and the first array. --> 129 coll = axes.fill_between(x, first_line, stack[0, :], 130 facecolor=next(colors), 131 hatch=next(hatch), 132 label=next(labels, None), 133 **kwargs) 134 coll.sticky_edges.y[:] = [0] 135 r = [coll] File ~\venv\alldays\Lib\site-packages\matplotlib\__init__.py:1486, in _preprocess_data.<locals>.inner(ax, data, *args, **kwargs) 1483 @functools.wraps(func) 1484 def inner(ax, *args, data=None, **kwargs): 1485 if data is None: -> 1486 return func( 1487 ax, 1488 *map(sanitize_sequence, args), 1489 **{k: sanitize_sequence(v) for k, v in kwargs.items()}) 1491 bound = new_sig.bind(ax, *args, **kwargs) 1492 auto_label = (bound.arguments.get(label_namer) 1493 or bound.kwargs.get(label_namer)) File ~\venv\alldays\Lib\site-packages\matplotlib\axes\_axes.py:5648, in Axes.fill_between(self, x, y1, y2, where, interpolate, step, **kwargs) 5646 def fill_between(self, x, y1, y2=0, where=None, interpolate=False, 5647 step=None, **kwargs): -> 5648 return self._fill_between_x_or_y( 5649 "x", x, y1, y2, 5650 where=where, interpolate=interpolate, step=step, **kwargs) File ~\venv\alldays\Lib\site-packages\matplotlib\axes\_axes.py:5564, in Axes._fill_between_x_or_y(self, ind_dir, ind, dep1, dep2, where, interpolate, step, **kwargs) 5561 if where.size != ind.size: 5562 raise ValueError(f"where size ({where.size}) does not match " 5563 f"{ind_dir} size ({ind.size})") -> 5564 where = where & ~functools.reduce( 5565 np.logical_or, map(np.ma.getmaskarray, [ind, dep1, dep2])) 5567 ind, dep1, dep2 = np.broadcast_arrays( 5568 np.atleast_1d(ind), dep1, dep2, subok=True) 5570 polys = [] ValueError: operands could not be broadcast together with shapes (1439,) (10,)
fig, ax = plt.subplots(figsize=(12,6))

ax.stackplot(horario.index,*[horario[electrico] for electrico in electricos],labels=electricos)

ax.legend()
plt.show()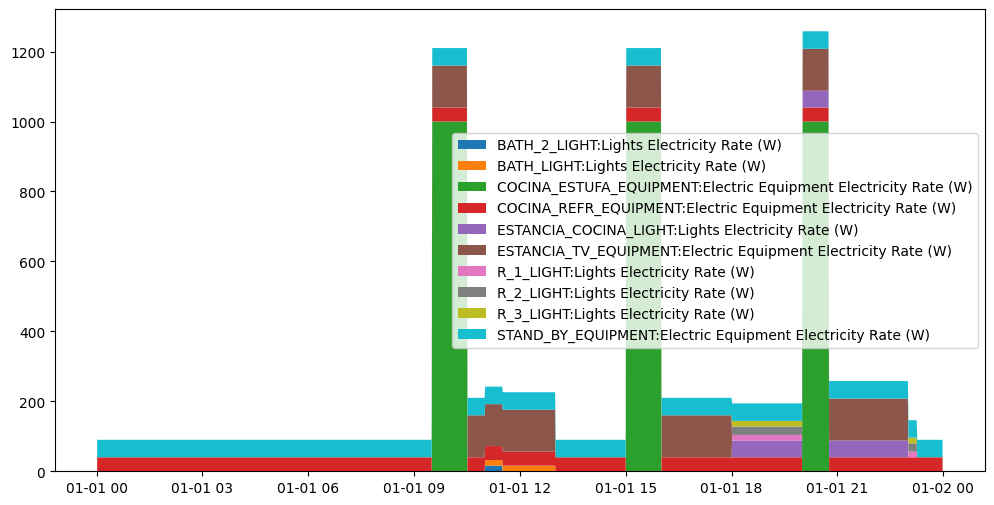
# En las nuevas versiones de matplotlib podemos no desempacar
fig, ax = plt.subplots(figsize=(12,6))

ax.stackplot(horario.index,[horario[electrico] for electrico in electricos],labels=electricos)

ax.legend()
print(*[columna for columna in horario.columns])BATH_2_LIGHT:Lights Electricity Rate (W) BATH_LIGHT:Lights Electricity Rate (W) COCINA_ESTUFA_EQUIPMENT:Electric Equipment Electricity Rate (W) COCINA_REFR_EQUIPMENT:Electric Equipment Electricity Rate (W) ESTANCIA_COCINA_LIGHT:Lights Electricity Rate (W) ESTANCIA_TV_EQUIPMENT:Electric Equipment Electricity Rate (W) R_1_LIGHT:Lights Electricity Rate (W) R_2_LIGHT:Lights Electricity Rate (W) R_3_LIGHT:Lights Electricity Rate (W) STAND_BY_EQUIPMENT:Electric Equipment Electricity Rate (W) B1:Space People Occupant Count () B2:Space People Occupant Count () COCINA:Space People Occupant Count () R1:Space People Occupant Count () R2:Space People Occupant Count () R3:Space People Occupant Count ()print([columna for columna in horario.columns])['BATH_2_LIGHT:Lights Electricity Rate (W)', 'BATH_LIGHT:Lights Electricity Rate (W)', 'COCINA_ESTUFA_EQUIPMENT:Electric Equipment Electricity Rate (W)', 'COCINA_REFR_EQUIPMENT:Electric Equipment Electricity Rate (W)', 'ESTANCIA_COCINA_LIGHT:Lights Electricity Rate (W)', 'ESTANCIA_TV_EQUIPMENT:Electric Equipment Electricity Rate (W)', 'R_1_LIGHT:Lights Electricity Rate (W)', 'R_2_LIGHT:Lights Electricity Rate (W)', 'R_3_LIGHT:Lights Electricity Rate (W)', 'STAND_BY_EQUIPMENT:Electric Equipment Electricity Rate (W)', 'B1:Space People Occupant Count ()', 'B2:Space People Occupant Count ()', 'COCINA:Space People Occupant Count ()', 'R1:Space People Occupant Count ()', 'R2:Space People Occupant Count ()', 'R3:Space People Occupant Count ()']