import pandas as pd
import matplotlib.pyplot as plt
from dateutil.parser import parse

# plt.style.use("grayscale")
# plt.style.use("seaborn-v0_8-talk")
plt.style.use("seaborn-v0_8-dark")
# plt.style.use("enerdata_square.mplstyle")
16 Temas en Matplotlib
plt.style.available['Solarize_Light2',
'_classic_test_patch',
'_mpl-gallery',
'_mpl-gallery-nogrid',
'bmh',
'classic',
'dark_background',
'fast',
'fivethirtyeight',
'ggplot',
'grayscale',
'seaborn-v0_8',
'seaborn-v0_8-bright',
'seaborn-v0_8-colorblind',
'seaborn-v0_8-dark',
'seaborn-v0_8-dark-palette',
'seaborn-v0_8-darkgrid',
'seaborn-v0_8-deep',
'seaborn-v0_8-muted',
'seaborn-v0_8-notebook',
'seaborn-v0_8-paper',
'seaborn-v0_8-pastel',
'seaborn-v0_8-poster',
'seaborn-v0_8-talk',
'seaborn-v0_8-ticks',
'seaborn-v0_8-white',
'seaborn-v0_8-whitegrid',
'tableau-colorblind10']f = '../data/Temixco_2018_10Min.csv'
tmx = pd.read_csv(f,index_col=0,parse_dates=True)
columnas = tmx.columns
columnasIndex(['Ib', 'Ig', 'To', 'RH', 'WS', 'WD', 'P'], dtype='object')fig, ax = plt.subplots(2,figsize=(12,4),sharex=True)
fecha1 = parse("2018-03-10")
fecha2 = fecha1 + pd.Timedelta("7D")
for columna in columnas[:2]:
ax[0].plot(tmx[columna],label=columna)
ax[1].plot(tmx.To,label="To")
for eje in ax:
eje.set_xlim(fecha1,fecha2)
eje.legend()
eje.grid()
ax[0].set_ylim(0,1200)
ax[1].set_ylim(18,35)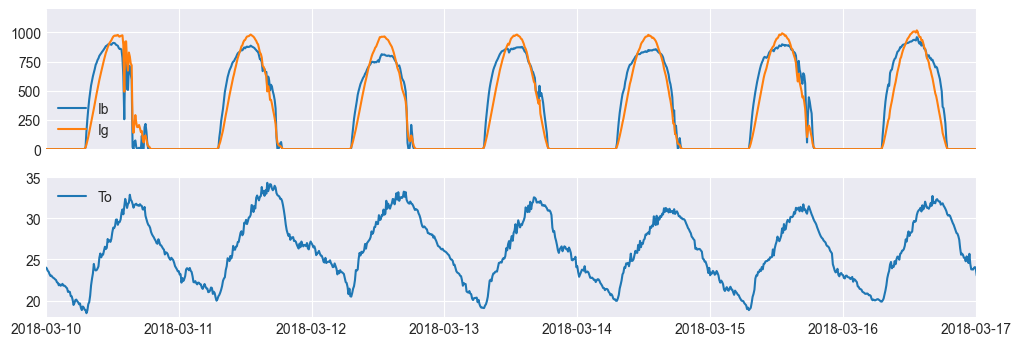
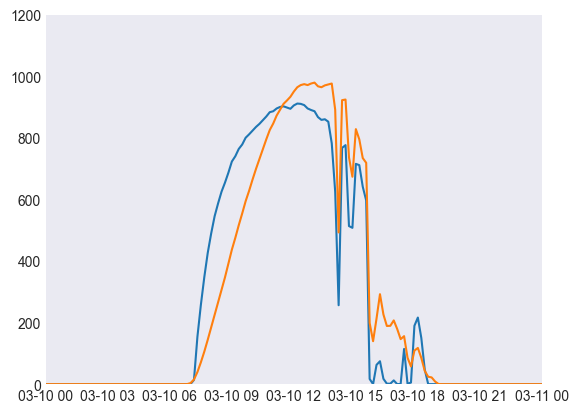
fig, ax = plt.subplots()

fecha1 = parse("2018-03-10")
fecha2 = fecha1 + pd.Timedelta("1D")

for columna in columnas[:2]:
    ax.plot(tmx[columna],label=columna)

ax.set_xlim(fecha1,fecha2)

ax.set_ylim(0,1200)