import pandas as pd
import matplotlib.pyplot as plt
from dateutil.parser import parse25 Promedios móvil
f = '../../data/Temixco_2018_10Min.csv'
tmx = pd.read_csv(f,index_col=0,parse_dates=True)
tmx.info()
<class 'pandas.core.frame.DataFrame'>
DatetimeIndex: 52560 entries, 2018-01-01 00:00:00 to 2018-12-31 23:50:00
Data columns (total 7 columns):
# Column Non-Null Count Dtype
--- ------ -------------- -----
0 Ib 52423 non-null float64
1 Ig 52423 non-null float64
2 To 52560 non-null float64
3 RH 52560 non-null float64
4 WS 52560 non-null float64
5 WD 52560 non-null float64
6 P 52560 non-null float64
dtypes: float64(7)
memory usage: 3.2 MB25.0.1 window = 6
Si la ventana es de 6, para este conjunto de datos, es cada hora
tmx['To'].rolling(window=6).mean()time
2018-01-01 00:00:00 NaN
2018-01-01 00:10:00 NaN
2018-01-01 00:20:00 NaN
2018-01-01 00:30:00 NaN
2018-01-01 00:40:00 NaN
...
2018-12-31 23:10:00 18.595000
2018-12-31 23:20:00 18.563333
2018-12-31 23:30:00 18.543333
2018-12-31 23:40:00 18.450000
2018-12-31 23:50:00 18.251667
Name: To, Length: 52560, dtype: float64tmx['To'].rolling(window=6,center=True).mean()time
2018-01-01 00:00:00 NaN
2018-01-01 00:10:00 NaN
2018-01-01 00:20:00 NaN
2018-01-01 00:30:00 18.900000
2018-01-01 00:40:00 18.988333
...
2018-12-31 23:10:00 18.543333
2018-12-31 23:20:00 18.450000
2018-12-31 23:30:00 18.251667
2018-12-31 23:40:00 NaN
2018-12-31 23:50:00 NaN
Name: To, Length: 52560, dtype: float64fig, ax = plt.subplots(figsize=(10,4))
fecha1 = parse('2018-06-26')
fecha2 = fecha1 + pd.Timedelta('1D')
ax.plot(tmx.To,'go',label='To')
ax.plot(tmx['To'].rolling(window=6).mean(),'ro',label='Window') # Cambiar window de 6 a 1
ax.plot(tmx['To'].rolling(window=6,center=True).mean(),'yo',label='Center') # Cambiar window de 6 a 1
ax.set_xlim(fecha1,fecha2)
ax.set_xlim(fecha1,fecha2)
ax.legend()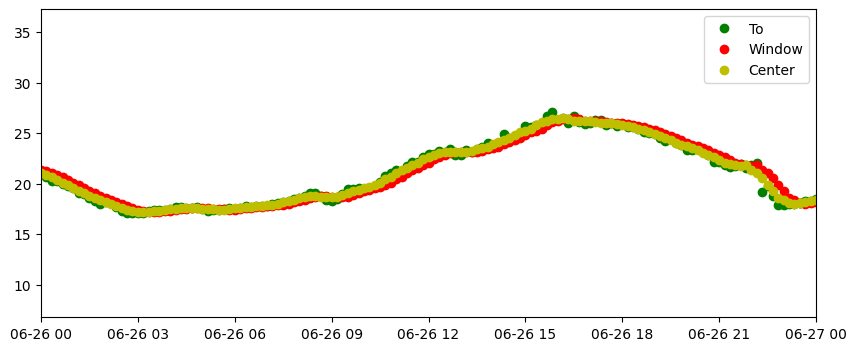
tmx['Ib'].expanding().mean().plot()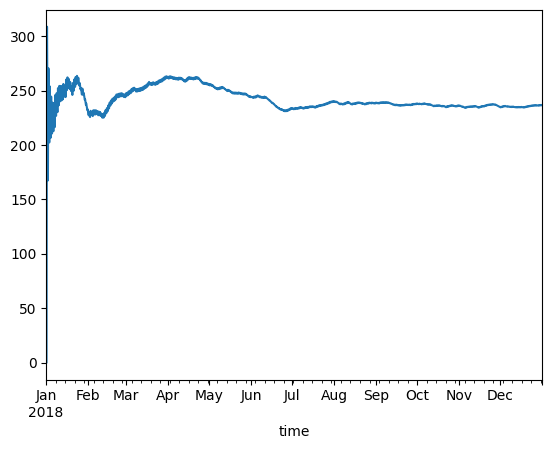
tmx.Ib.mean()236.74272595997937tmx['Ib'].expanding().mean().plot()
25.1 EMA en funci’on de alpha
tmx['To'].ewm(span=144).mean().plot()
tmx.To.resample('D').mean().plot()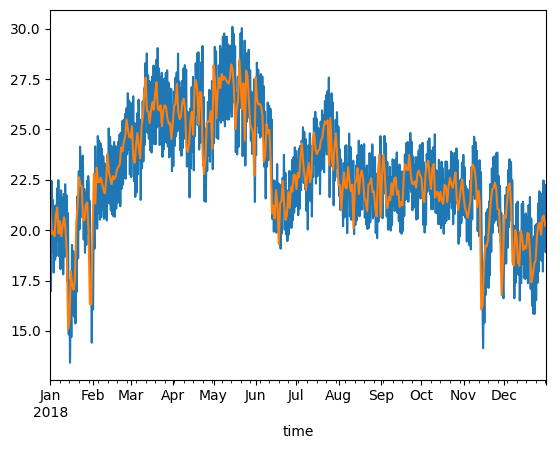
25.2 Explora en rolling el uso de:
- closed
- el uso de timedelta en window
- step
- axis
- on
25.3 Para expanding explora:
- min_periods
- axis ## Para ewm explora
- $ _t = t + (1 - ) {t-1} $
- span
- com
- halflife
- alpha