import pandas as pd
import matplotlib.pyplot as plt
from dateutil.parser import parse13 Intro rápida a Matplotlib
f = '../../data/Temixco_2018_10Min.csv'
tmx = pd.read_csv(f,index_col=0,parse_dates=True)
tmx.columns
Index(['Ib', 'Ig', 'To', 'RH', 'WS', 'WD', 'P'], dtype='object')fig, ax = plt.subplots(figsize=(12,4),sharex=True)
# fecha1 = parse('2018-03-10')
# fecha2 = fecha1 + pd.Timedelta('3D')
ax.plot(tmx['Ig'],label='Ig')
ax.plot(tmx['Ib'],label='Ib')
ax.legend()
# ax.set_xlim(fecha1,fecha2)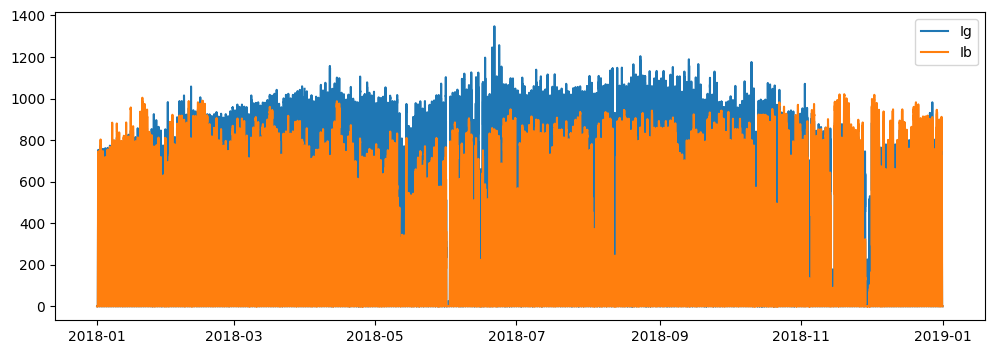
f = '../../data/personas_cargas.csv'
cargas = pd.read_csv(f,index_col=0,parse_dates=True)
columnas = cargas.columns
columnas
Index(['BATH_2_LIGHT:Lights Electricity Rate (W)',
'BATH_LIGHT:Lights Electricity Rate (W)',
'COCINA_ESTUFA_EQUIPMENT:Electric Equipment Electricity Rate (W)',
'COCINA_REFR_EQUIPMENT:Electric Equipment Electricity Rate (W)',
'ESTANCIA_COCINA_LIGHT:Lights Electricity Rate (W)',
'ESTANCIA_TV_EQUIPMENT:Electric Equipment Electricity Rate (W)',
'R_1_LIGHT:Lights Electricity Rate (W)',
'R_2_LIGHT:Lights Electricity Rate (W)',
'R_3_LIGHT:Lights Electricity Rate (W)',
'STAND_BY_EQUIPMENT:Electric Equipment Electricity Rate (W)',
'B1:Space People Occupant Count ()',
'B2:Space People Occupant Count ()',
'COCINA:Space People Occupant Count ()',
'R1:Space People Occupant Count ()',
'R2:Space People Occupant Count ()',
'R3:Space People Occupant Count ()'],
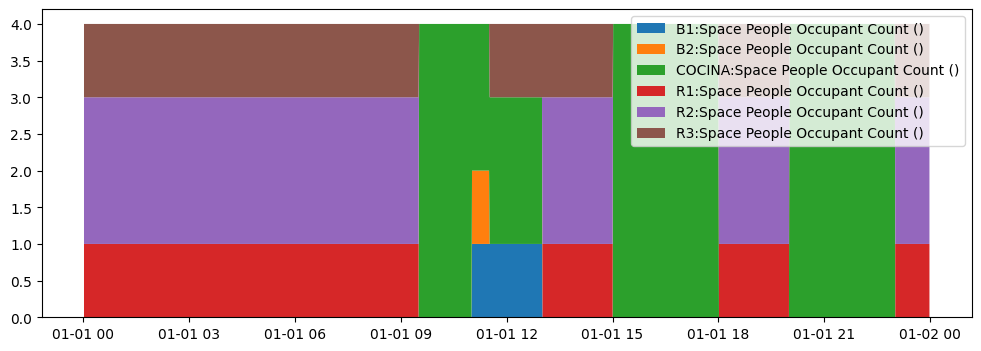
dtype='object')etiquetas = [columna for columna in columnas if 'People' in columna]
etiquetas['B1:Space People Occupant Count ()',
'B2:Space People Occupant Count ()',
'COCINA:Space People Occupant Count ()',
'R1:Space People Occupant Count ()',
'R2:Space People Occupant Count ()',
'R3:Space People Occupant Count ()']fig, ax = plt.subplots(figsize=(12,4))
ax.stackplot(cargas.index,[cargas[columna] for columna in columnas if 'People' in columna],labels= etiquetas)
ax.legend();