import pandas as pd
import matplotlib.pyplot as plt
from iertools.read import read_epw7 Usando read_epw para leer EPWs
f = "../EPW/MEX_MOR_Cuernavaca-Matamoros.Intl.AP.767260_TMYx.2009-2023.epw"
cue = read_epw(f,alias=True)
cue = cue[~((cue.index.month == 2) & (cue.index.day == 29))]
cue.index = cue.index.map(lambda x: x.replace(year=2023))
cue| Data Source and Uncertainty Flags | To | Dew Point Temperature | RH | P | Extraterrestrial Horizontal Radiation | Extraterrestrial Direct Normal Radiation | Horizontal Infrared Radiation Intensity | Ig | Ib | ... | Ceiling Height | Present Weather Observation | Present Weather Codes | Precipitable Water | Aerosol Optical Depth | Snow Depth | Days Since Last Snowfall | Albedo | Liquid Precipitation Depth | Liquid Precipitation Quantity | |
|---|---|---|---|---|---|---|---|---|---|---|---|---|---|---|---|---|---|---|---|---|---|
| tiempo | |||||||||||||||||||||
| 2023-01-01 01:00:00 | ?9?9?9?9E0?9?9?9*9*9?9?9?9*9?9?9*9?9*9*9?9*9 | 14.6 | 5.6 | 55 | 86614 | 0 | 0 | 303 | 0 | 0 | ... | 2007 | 9 | 999999999 | 15 | 0.085 | 0 | 88 | 0.14 | 0.0 | 0.0 |
| 2023-01-01 02:00:00 | ?9?9?9?9E0?9?9?9*9*9?9?9?9*9?9?9*9?9*9*9?9*9 | 14.3 | 5.4 | 55 | 86614 | 0 | 0 | 304 | 0 | 0 | ... | 1796 | 9 | 999999999 | 15 | 0.085 | 0 | 88 | 0.14 | 0.0 | 0.0 |
| 2023-01-01 03:00:00 | ?9?9?9?9E0?9?9?9*9*9?9?9?9*9?9?9*9?9*9*9?9*9 | 14.0 | 6.6 | 61 | 86614 | 0 | 0 | 311 | 0 | 0 | ... | 1635 | 9 | 999999999 | 17 | 0.085 | 0 | 88 | 0.14 | 0.0 | 0.0 |
| 2023-01-01 04:00:00 | ?9?9?9?9E0?9?9?9*9*9?9?9?9*9?9?9*9?9*9*9?9*9 | 12.7 | 4.6 | 58 | 86614 | 0 | 0 | 316 | 0 | 0 | ... | 1500 | 9 | 999999999 | 14 | 0.085 | 0 | 88 | 0.14 | 0.0 | 0.0 |
| 2023-01-01 05:00:00 | ?9?9?9?9E0?9?9?9*9*9?9?9?9?9?9?9*9?9*9*9?9*9 | 12.1 | 6.0 | 48 | 87096 | 0 | 0 | 307 | 0 | 0 | ... | 1467 | 9 | 999999999 | 16 | 0.085 | 0 | 88 | 0.14 | 0.0 | 0.0 |
| ... | ... | ... | ... | ... | ... | ... | ... | ... | ... | ... | ... | ... | ... | ... | ... | ... | ... | ... | ... | ... | ... |
| 2023-12-31 20:00:00 | ?9?9?9?9E0?9?9?9?9*9?9?9?9*9?9?9*9?9*9*9?9*9 | 21.3 | 9.5 | 47 | 87531 | 0 | 0 | 325 | 0 | 0 | ... | 2691 | 9 | 999999999 | 22 | 0.085 | 0 | 88 | 0.13 | 0.0 | 0.0 |
| 2023-12-31 21:00:00 | ?9?9?9?9E0?9?9?9?9*9?9?9?9*9?9?9*9?9*9*9?9*9 | 19.3 | 9.2 | 52 | 87531 | 0 | 0 | 320 | 0 | 0 | ... | 2618 | 9 | 999999999 | 22 | 0.085 | 0 | 88 | 0.13 | 0.0 | 0.0 |
| 2023-12-31 22:00:00 | ?9?9?9?9E0?9?9?9?9*9?9?9?9*9?9?9*9?9*9*9?9*9 | 19.1 | 10.1 | 56 | 87531 | 0 | 0 | 316 | 0 | 0 | ... | 2617 | 9 | 999999999 | 24 | 0.085 | 0 | 88 | 0.13 | 0.0 | 0.0 |
| 2023-12-31 23:00:00 | ?9?9?9?9E0?9?9?9?9*9?9?9?9*9?9?9*9?9*9*9?9*9 | 16.9 | 9.8 | 63 | 87531 | 0 | 0 | 315 | 0 | 0 | ... | 77777 | 9 | 999999999 | 23 | 0.085 | 0 | 88 | 0.13 | 0.0 | 0.0 |
| 2023-01-01 00:00:00 | ?9?9?9?9E0?9?9?9?9*9?9?9?9*9?9?9*9?9*9*9?9*9 | 16.2 | 10.1 | 67 | 87531 | 0 | 0 | 312 | 0 | 0 | ... | 77777 | 9 | 999999999 | 24 | 0.085 | 0 | 88 | 0.13 | 0.0 | 0.0 |
8759 rows × 30 columns
cue.plot(subplots=True,figsize=(12,20))array([<Axes: xlabel='tiempo'>, <Axes: xlabel='tiempo'>,
<Axes: xlabel='tiempo'>, <Axes: xlabel='tiempo'>,
<Axes: xlabel='tiempo'>, <Axes: xlabel='tiempo'>,
<Axes: xlabel='tiempo'>, <Axes: xlabel='tiempo'>,
<Axes: xlabel='tiempo'>, <Axes: xlabel='tiempo'>,
<Axes: xlabel='tiempo'>, <Axes: xlabel='tiempo'>,
<Axes: xlabel='tiempo'>, <Axes: xlabel='tiempo'>,
<Axes: xlabel='tiempo'>, <Axes: xlabel='tiempo'>,
<Axes: xlabel='tiempo'>, <Axes: xlabel='tiempo'>,
<Axes: xlabel='tiempo'>, <Axes: xlabel='tiempo'>,
<Axes: xlabel='tiempo'>, <Axes: xlabel='tiempo'>,
<Axes: xlabel='tiempo'>, <Axes: xlabel='tiempo'>,
<Axes: xlabel='tiempo'>, <Axes: xlabel='tiempo'>,
<Axes: xlabel='tiempo'>, <Axes: xlabel='tiempo'>,
<Axes: xlabel='tiempo'>], dtype=object)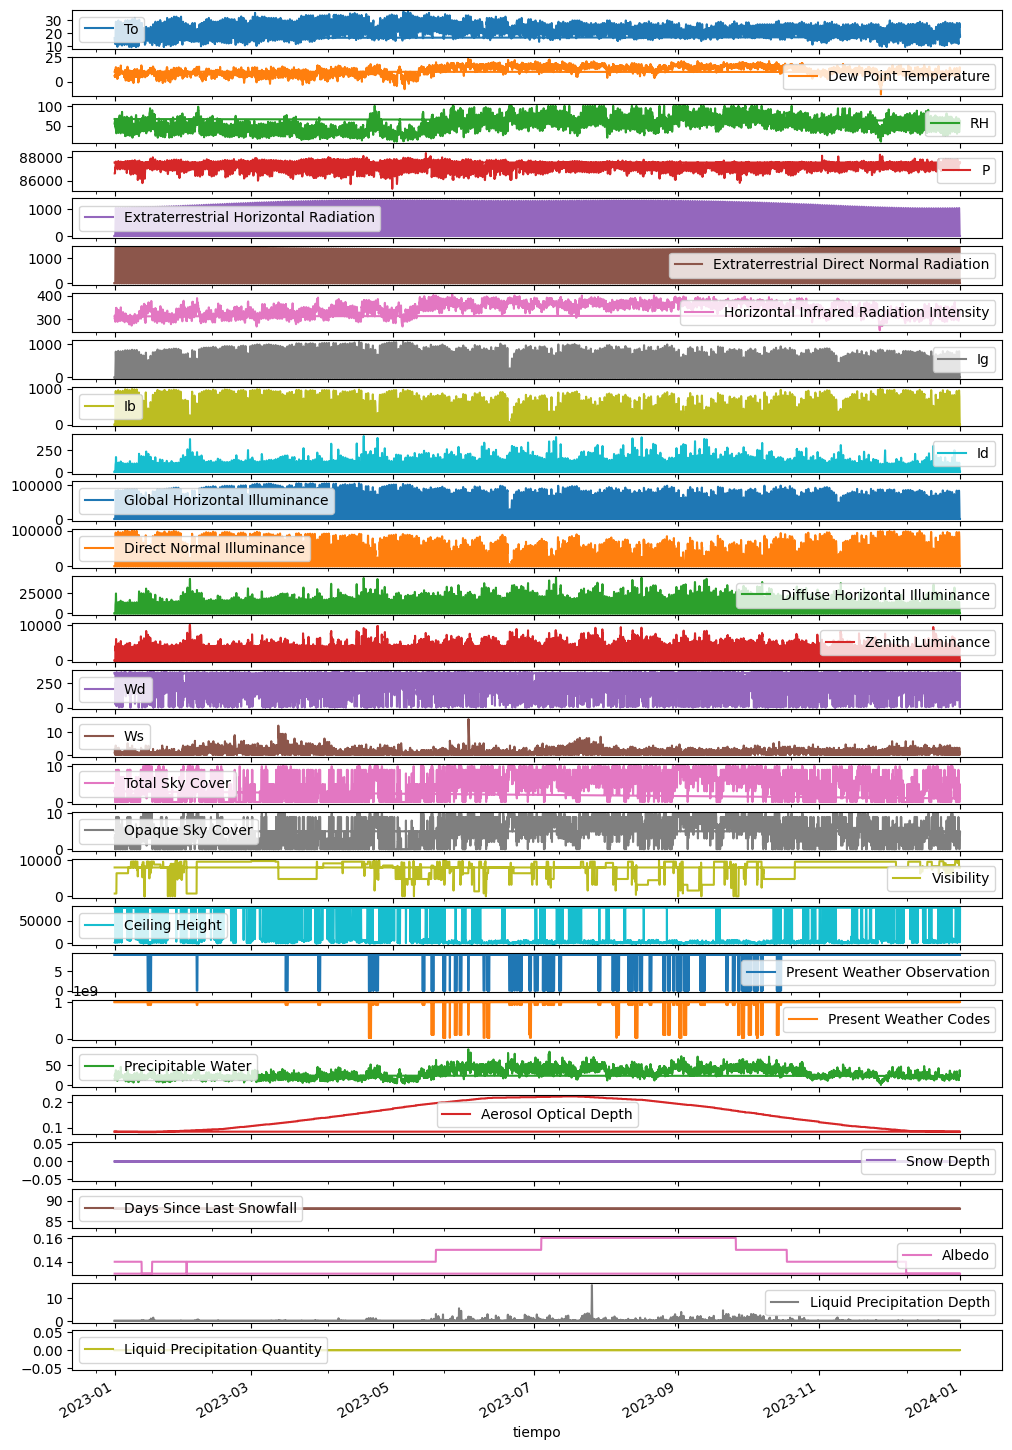
cue.To.resample("ME").mean()tiempo
2023-01-31 19.201210
2023-02-28 20.632440
2023-03-31 23.272275
2023-04-30 25.076806
2023-05-31 24.850538
2023-06-30 23.084444
2023-07-31 22.239113
2023-08-31 22.016263
2023-09-30 21.021528
2023-10-31 21.531720
2023-11-30 20.194444
2023-12-31 18.805511
Freq: ME, Name: To, dtype: float64