import pandas as pd
import matplotlib.pyplot as plt
from iertools.read import read_sql
from dateutil.parser import parse6 Usando read_sql de iertools para cargar datos
f = "../Osm/Mi_primer_cubo_002/run/eplusout.sql"
cubo = read_sql(f,alias=True)
# cubo.construction_systems
data_cubo = cubo.data
data_cubo| variable_name | Ti_CUBO | Id | Ib | To | TECHO:Surface Outside Face Incident Solar Radiation Rate per Area (W/m2) |
|---|---|---|---|---|---|
| date | |||||
| 2006-01-01 00:10:00 | 24.536431 | 0.0 | 0.0 | 13.766667 | 0.0 |
| 2006-01-01 00:20:00 | 24.302943 | 0.0 | 0.0 | 13.933333 | 0.0 |
| 2006-01-01 00:30:00 | 24.073180 | 0.0 | 0.0 | 14.100000 | 0.0 |
| 2006-01-01 00:40:00 | 23.846635 | 0.0 | 0.0 | 14.266667 | 0.0 |
| 2006-01-01 00:50:00 | 23.624291 | 0.0 | 0.0 | 14.433333 | 0.0 |
| ... | ... | ... | ... | ... | ... |
| 2006-12-31 23:20:00 | 27.857083 | 0.0 | 0.0 | 16.666667 | 0.0 |
| 2006-12-31 23:30:00 | 27.616217 | 0.0 | 0.0 | 16.550000 | 0.0 |
| 2006-12-31 23:40:00 | 27.377977 | 0.0 | 0.0 | 16.433333 | 0.0 |
| 2006-12-31 23:50:00 | 27.142483 | 0.0 | 0.0 | 16.316667 | 0.0 |
| 2007-01-01 00:00:00 | 26.910401 | 0.0 | 0.0 | 16.200000 | 0.0 |
52560 rows × 5 columns
sc = cubo.construction_systems
cubo.get_construction(sc)
Construction system:CDA15CMA0P7

Total thickness    :0.15 m

Total layers:[1]

InsideAbsorpVis:[0.7]

OutsideAbsorpVis:[0.7]

OutsideAbsorpSolar:[0.7]

InsideAbsorpThermal:[0.9]

OutsideRoughness:[2]
| NameMaterial | Conductivity | Density | SpecHeat | Thickness | |
|---|---|---|---|---|---|
| 0 | CDA15cma0p7 | 2.0 | 2500.0 | 1400.0 | 0.15 |
Construction system:LADRILLO14CMA0P7

Total thickness    :0.14 m

Total layers:[1]

InsideAbsorpVis:[0.7]

OutsideAbsorpVis:[0.7]

OutsideAbsorpSolar:[0.7]

InsideAbsorpThermal:[0.9]

OutsideRoughness:[2]
| NameMaterial | Conductivity | Density | SpecHeat | Thickness | |
|---|---|---|---|---|---|
| 1 | Ladrillo14cma0p7 | 1.4 | 1400.0 | 1000.0 | 0.14 |
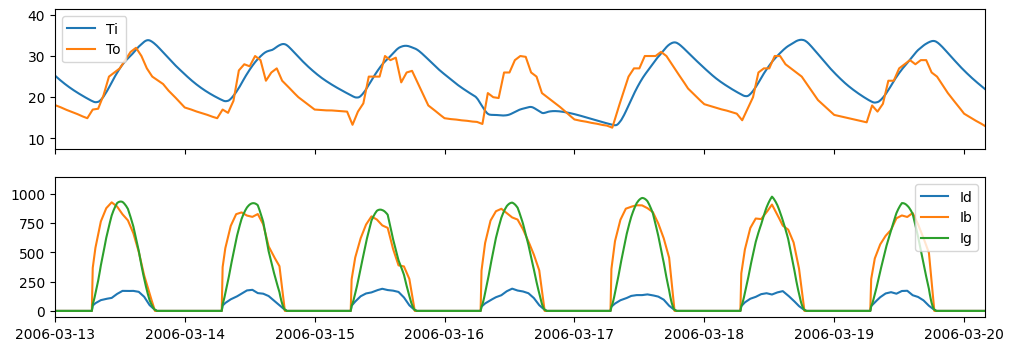
fig, ax = plt.subplots(2,1,figsize=(12,4),sharex=True)

f1 = parse("2006-03-13")
f2 = f1 + pd.Timedelta("7D3h50min")

ax[0].plot(data_cubo.Ti_CUBO,label="Ti")
ax[0].plot(data_cubo.To,label="To")

ax[1].plot(data_cubo.Id,label="Id")
ax[1].plot(data_cubo.Ib,label="Ib")
ax[1].plot(data_cubo["TECHO:Surface Outside Face Incident Solar Radiation Rate per Area (W/m2)"],label="Ig")

ax[0].legend()
ax[1].legend()

ax[1].set_xlim(f1,f2)